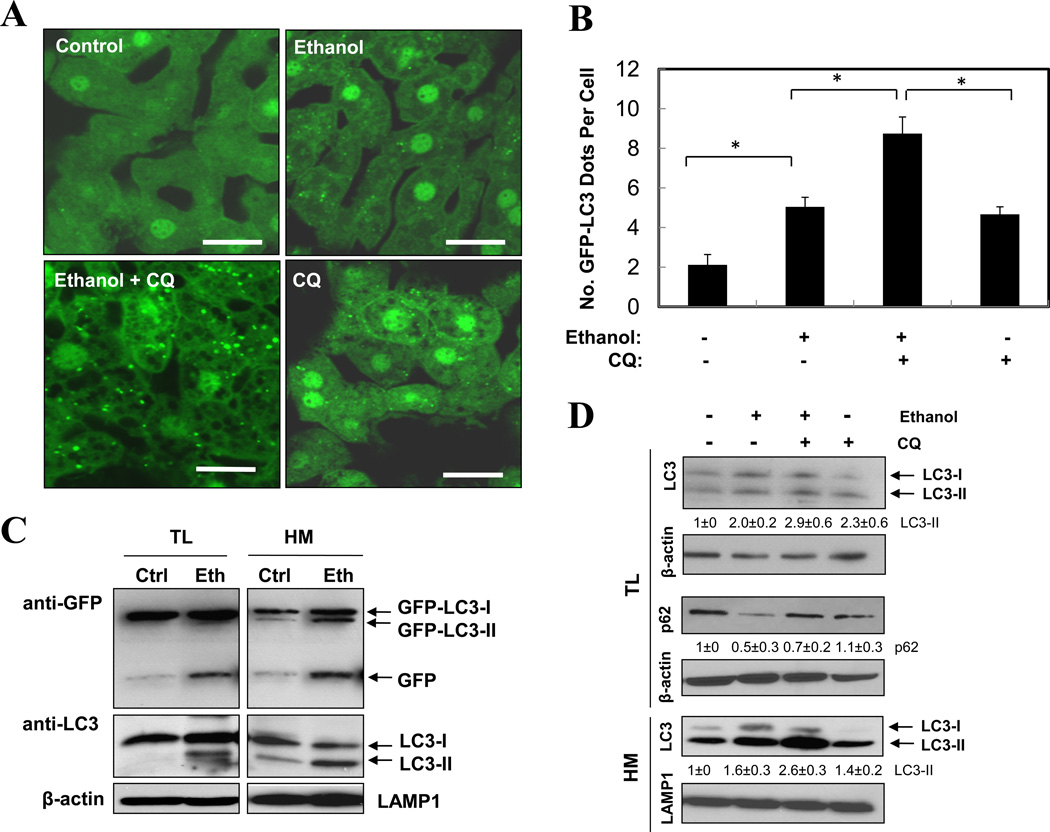
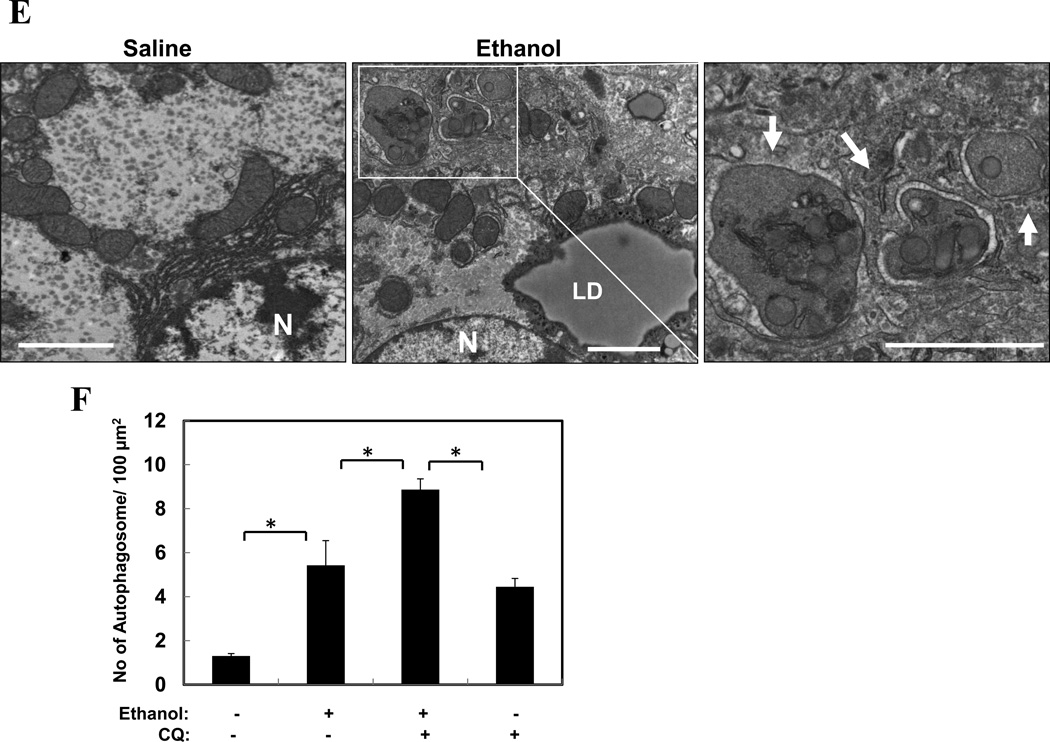
Figure 1. Acute ethanol exposure induces autophagy in the liver.
(A–C). GFP-LC3 transgenic mice (n=3–5) were treated as indicated and the liver sections were analyzed by confocal microscopy (A). The number of GFP-LC3 dots (mean+SEM) were quantified from each animal (B). The total lysates (TL) and the heavy membrane fraction (HM) of the liver were analyzed by immunoblot assay (C). (D) Wild type mice were treated as indicated (n=3) and the liver fractions were analyzed by immunoblot assay. Densitometry analysis of the LC3-II and p62 was performed for each sample (mean+SEM). (E). Wild type liver samples were processed for EM. Arrows denote autophagosomes. N: nucleus, LD: lipid droplet. (F). The number of autophagosomes per given area (mean+SEM) was determined (n=3–4). Scale bar: 20 µm (A), 2 µm (E). *: p<0.05.


