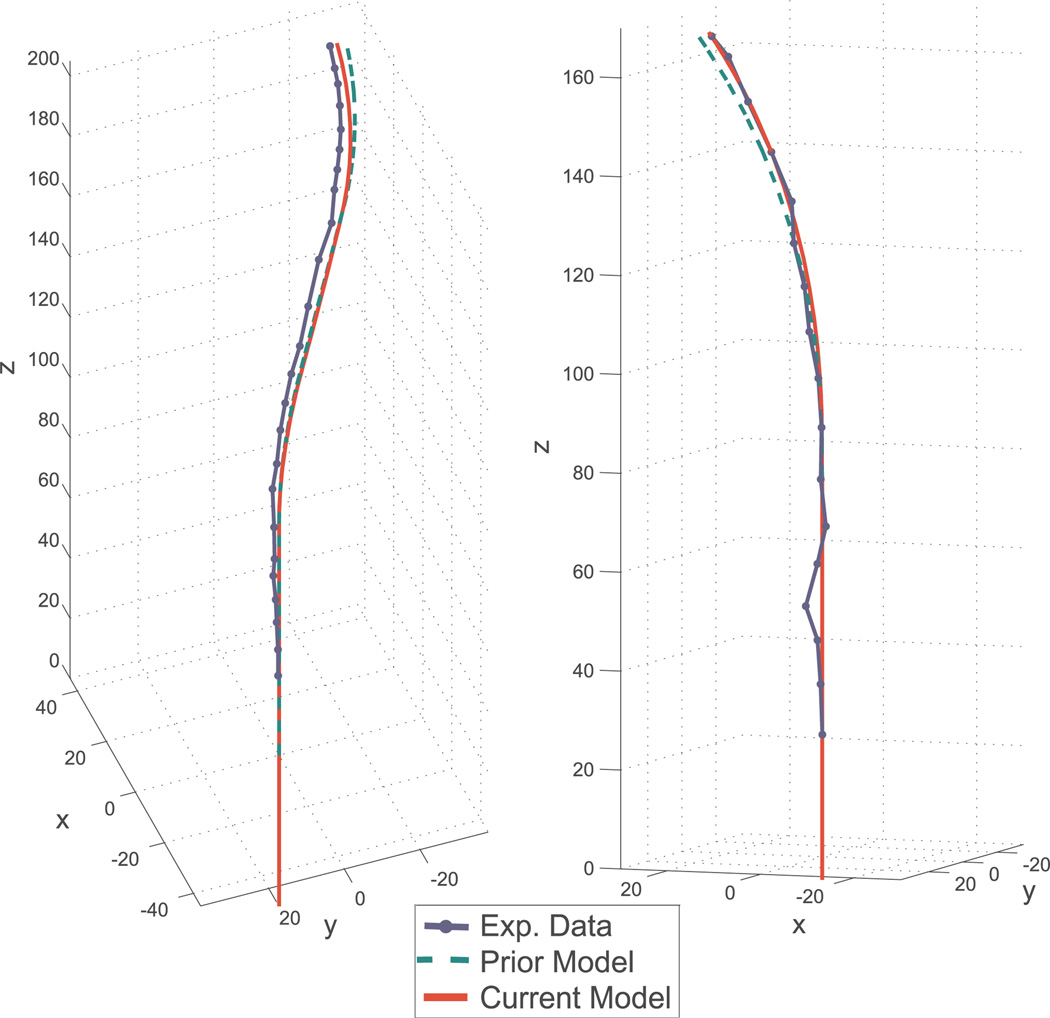
Fig. 11.
Comparison of shape for the transmissional torsion model (green – dotted line) with calibrated parameters, the model given in Section 4 (red – solid line) with calibrated parameters, and experimental data (blue – dashed line) for configurations near the edge of the active cannula workspace. Note that the model given in Section 4 produces predictions closer to experimentally observed cannula shape. Left: partial overlap case. Right: full overlap case.

