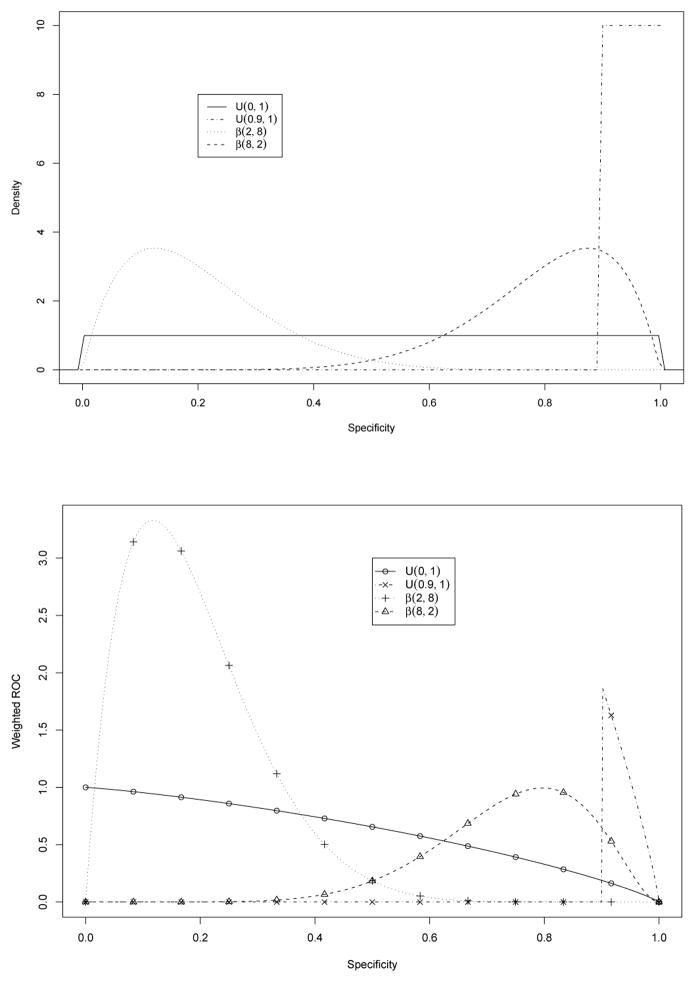
Fig. 2.
Weight functions (upper panel) and weighted ROC curves (lower panel). In the lower panel, the solid line is the original ROC curve, also corresponding to U(0,1). 13 points (circles) on this curve are marked and their corresponding weighted values are symboled with different point characters on the other three weighted ROC curves.

