
Fig. 3.
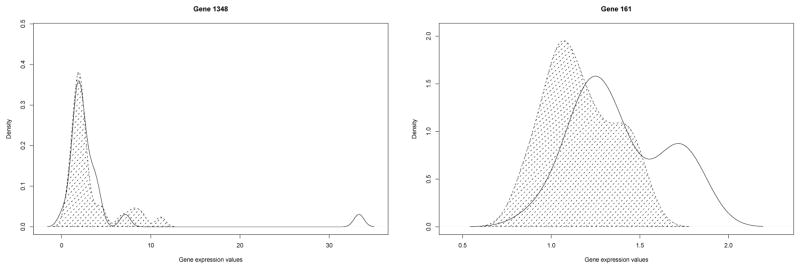
Distribution of gene expressions for the diseased and normal populations from the Ovarian cancer dataset. The area under the density for the cancer patients is shaded.
Official websites use .gov
A
.gov website belongs to an official
government organization in the United States.
Secure .gov websites use HTTPS
A lock (
) or https:// means you've safely
connected to the .gov website. Share sensitive
information only on official, secure websites.
Distribution of gene expressions for the diseased and normal populations from the Ovarian cancer dataset. The area under the density for the cancer patients is shaded.