Figure 1.

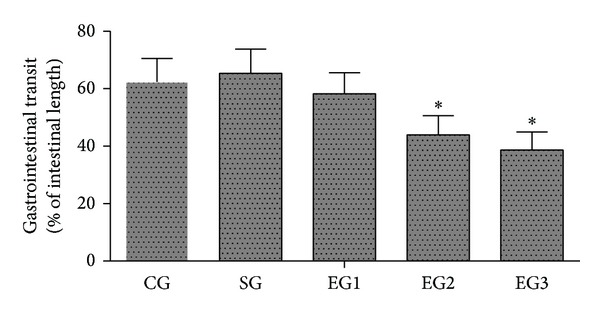
Gastrointestinal transit. CG: control group; SG: sham group; EG1, EG2, and EG3: exposure groups with peritoneal air exposure for 1, 2, and 3 h, respectively. The data are expressed as mean ± SD, n = 8. *P < 0.05, versus the CG group.

Gastrointestinal transit. CG: control group; SG: sham group; EG1, EG2, and EG3: exposure groups with peritoneal air exposure for 1, 2, and 3 h, respectively. The data are expressed as mean ± SD, n = 8. *P < 0.05, versus the CG group.