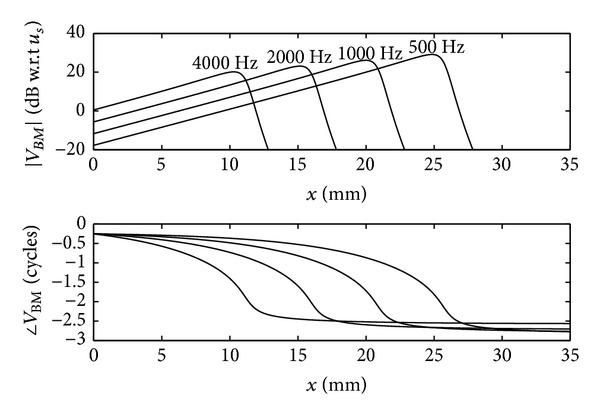
Figure 10.

Simulations of the distribution of the magnitude and phase (plot with respect to the velocity at the stapes, u S) of the complex basilar membrane velocity along the length of the passive cochlea when excited by pure tones at different frequencies.
