Figure 15.

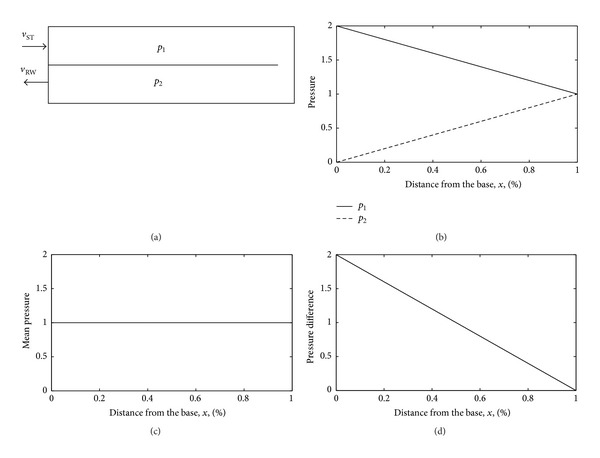
(a) The box model of the cochlea, (b) the pressure distributions in the upper and lower chambers as p 1 and p 2, (c) the mean pressure, and (d) the pressure difference.

(a) The box model of the cochlea, (b) the pressure distributions in the upper and lower chambers as p 1 and p 2, (c) the mean pressure, and (d) the pressure difference.