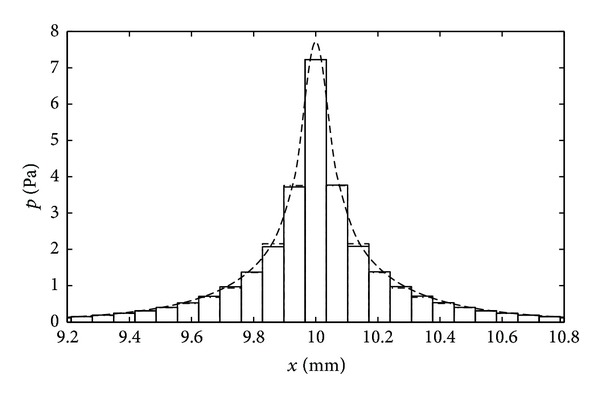
Figure 18.

Continuous distribution of the modal pressure along the cochlea due to the fluid coupling near-field component (dashed line) and the average pressure over each discrete element of the BM (solid line), when excited by a single element at x = 10 mm with a velocity of 10 mm s−1 at a frequency of 1 kHz. Also shown (dot-dashed line) is the approximation to this discrete distribution obtained from the sum of two exponentially decaying terms of an acoustic analysis of the fluid coupling, (48).
