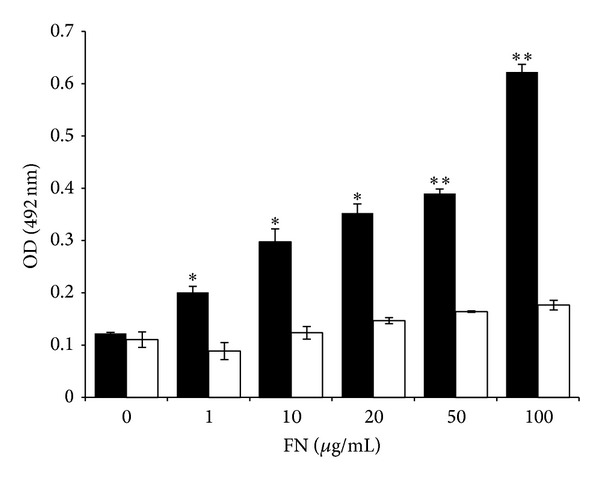
Figure 4.

Dose-response curves assayed by ELISA. Plates were coated with EF-Tu (black bars) or AhpC (white bars) used as negative control and incubated with different concentrations of FN. The absorbance, measured at 492 nm, showed a dose-dependent interaction confirming the binding of EF-Tu with FN. Significantly different from values of the control protein AhpC **P < 0.01, *P < 0.05.
