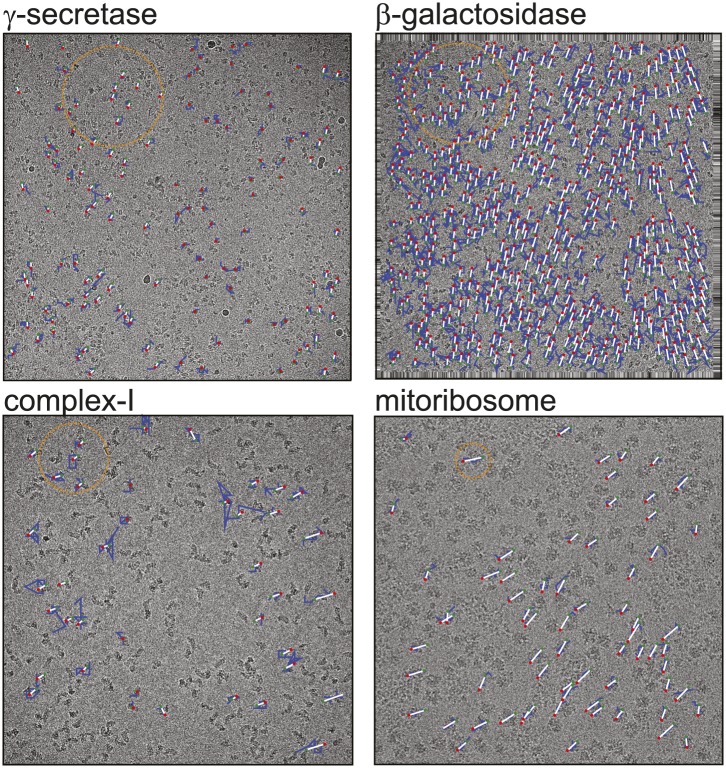
Figure 1. Beam-induced movement tracks.
A representative micrograph for each of the four test cases is shown, on top of which 50-fold exaggerated beam-induced particle movements are plotted. The original tracks as estimated for running averages of several movie frames for each particle independently are shown in blue; the fitted linear tracks are shown in white. The start and end points of the fitted tracks are indicated with green and red dots, respectively. The orange circles indicate the 2σNB distance for one of the particles on the micrographs. Note that tracks are only shown for those particles that were selected for the final reconstruction after 2D and 3D classification. Also note that the relatively small movement tracks for γ-secretase only represent the beam-induced motion that was not already corrected for in the algorithm by Li et al. (2013).

