Figure 3. Map improvement.
Representative parts of the density maps for all four test cases before (left of the arrow) and after the new movie processing approach (right of the arrow).

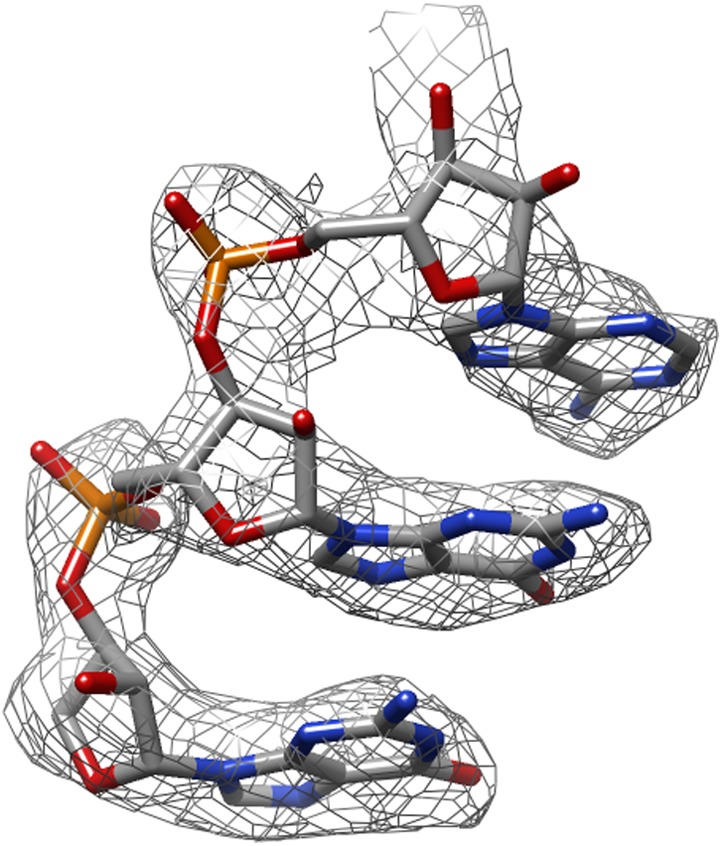
Figure 3—figure supplement 1. The same part of the mitoribosome large sub-unit map as shown in Figure 3, but after application of the original movie processing approach, as described in Bai et al. (2013).