
FIGURE 5.
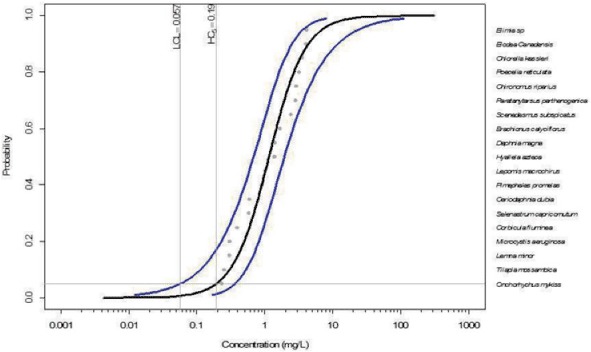
SSD for the full C11.6 LAS data set (n = 19 taxa). The blue lines represent the 95% upper and lower confidence intervals of the regression. The predicted HC5 of 0.19 mg/L is slightly less than the most sensitive species tested, rainbow trout, at 0.23 mg/L.