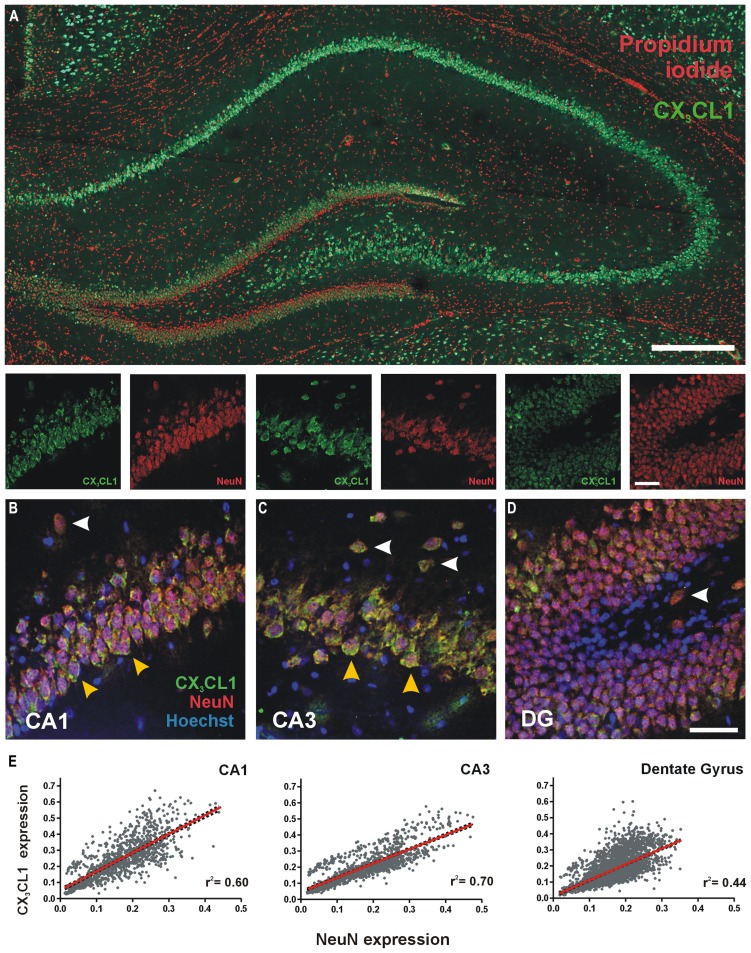
FIGURE 1.
Expression of CX3CL1 in the CA1, CA3 and dentate gyrus (DG) of the rat hippocampus. (A) Basal levels of CX3CL1 expression in the rat dorsal hippocampus. Green: CX3CL1; Red: propidium iodide-stained nuclei. Scale bar = 200 μm. (B–D) CA1, CA3 and DG regions of the hippocampus, respectively, showing CX3CL1 (green), NeuN (red) and Hoechst (blue) expression. White arrowheads: interneurons; yellow arrowheads: CA pyramidal neurons. (E) Relationship between CX3CL1 and NeuN expression. Each dot represents a single cell. Linear regression analyses (red lines) appear on each plot with corresponding r2 values indicated. Linear regression p < 0.05 for CA1, CA3 and DG regions of the hippocampus.

