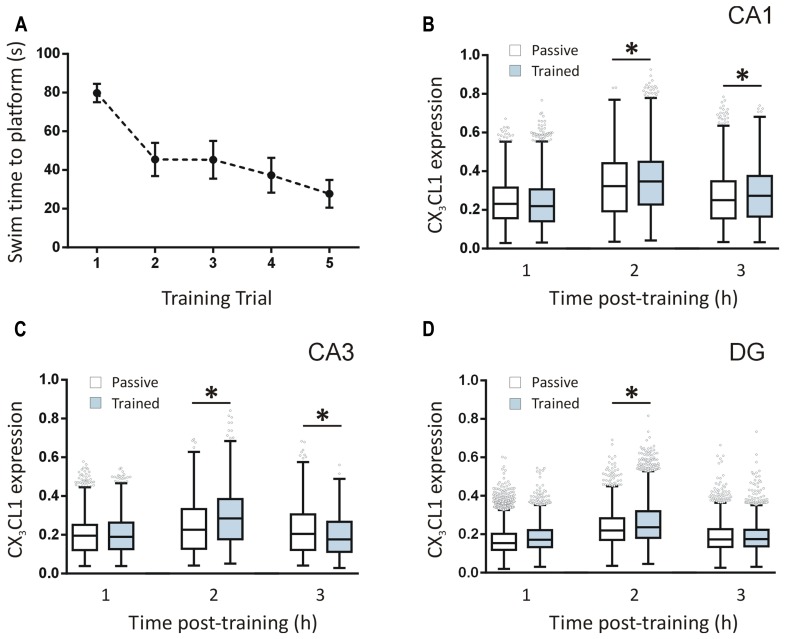
FIGURE 2.
Temporal changes in CX3CL1 expression in the rat hippocampus post-spatial learning measured by immunofluorescence. (A) Graph shows the average latency-to-platform times for rats trained in a single session (five trials) of the water maze task (n = 12). (B–D) Box plots represent the distributions of fluorescence intensity values for CX3CL1 protein expression in CA1, CA3, and DG cells at 1, 2 and 3 h post-water maze training, compared to passive control animals. Changes in CX3CL1 expression were analyzed using Kruskal–Wallis ANOVA and Dunn’s multiple comparisons post hoc tests; ∗p < 0.01. There were four rats per time-point and three hippocampal sections analyzed per animal. The numbers of cells analyzed per hippocampal region were as follows: CA1: 1116–1201 cells; CA3: 1090–1247 cells; DG: 2888–3455 cells. The numbers of cells analyzed per time-point were: 1 h: 11,526 cells; 2 h: 10,355 cells; 3 h: 10,867 cells.

