Figure 12.

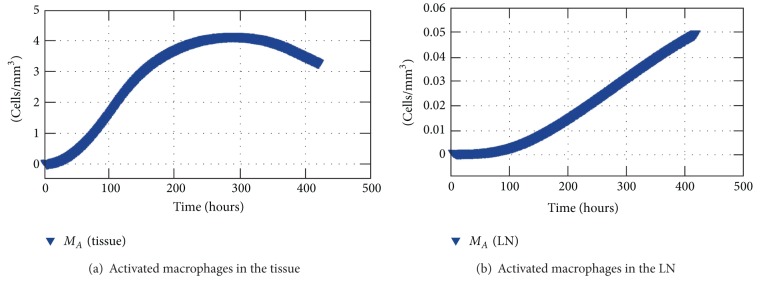
Average concentration of activated macrophages in the tissue and concentration of activated macrophages in the nearest LN.

Average concentration of activated macrophages in the tissue and concentration of activated macrophages in the nearest LN.