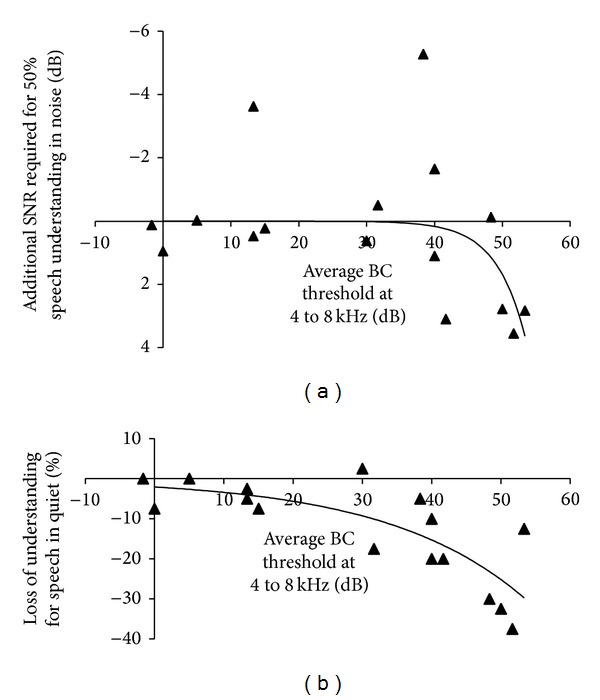
Figure 8.

Difference between speech understanding in the “Abutment” and the “Magnet 3” condition as a function of the average BC hearing loss of the better ear at 4, 6, and 8 kHz. Data points for individual subjects and nonlinear regression lines are shown. (a) Speech understanding in noise. (b) Speech understanding in quiet. In both panels, data points closer to the bottom of the graph denote lower speech understanding with Magnet 3.
