Figure 7.

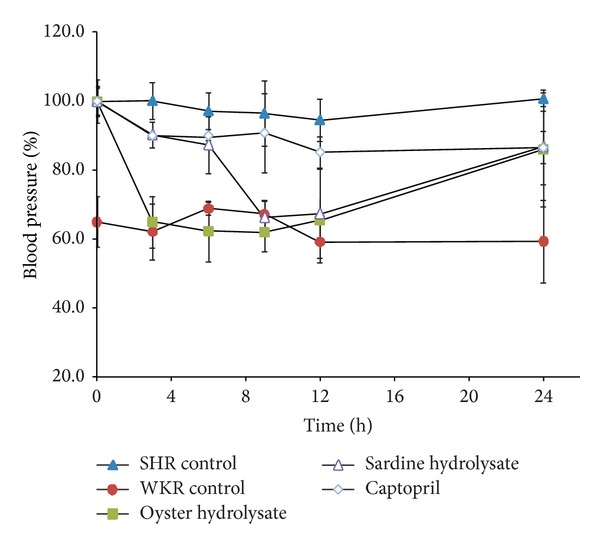
The SBP change of the test groups over time, compared with the initial SBP of each group, respectively; oyster hydrolysate, 100 mg/kg; sardine hydrolysate, 100 mg/kg; and Captopril, 8 mg/kg.

The SBP change of the test groups over time, compared with the initial SBP of each group, respectively; oyster hydrolysate, 100 mg/kg; sardine hydrolysate, 100 mg/kg; and Captopril, 8 mg/kg.