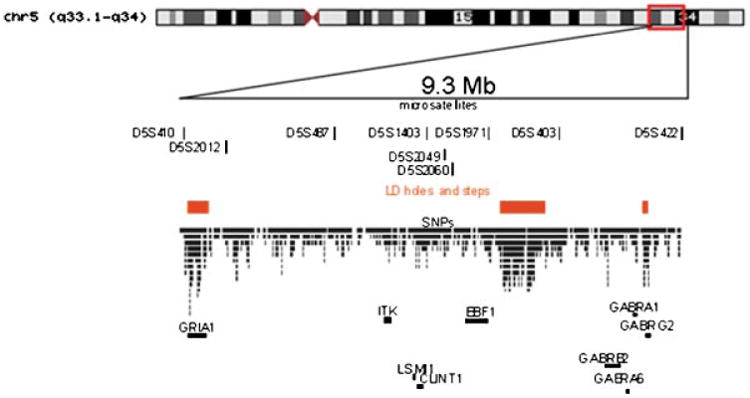
Fig. 1.

Molecular structure of the region under the linkage peak on chromosome 5q31–34. We show here microsatellite markers, SNPs and localization of linkage disequilibrium holes, and candidate genes in the chromosomal region (GRIA1: ionotropic glutamate receptor 1, AMPA1, #138248; ITK: IL2-inducible T-cell kinase, MIM#186973; LSM11: U7 small nuclear RNA-associated Sm-like protein, gene ID 134353; EBF1: early B-cell factor 1, MIM#164343; GABRB2, gamma-aminobutyric acid (GABA) A receptor, beta 2, MIM#600232; GABRA6, gamma-aminobutyric acid (GABA) A receptor, alpha 6, MIM#137143; GABRA1, gamma-aminobutyric acid (GABA) A receptor, alpha 1, MIM#137160; GABRG2, gamma-aminobutyric acid (GABA) A receptor, gamma 2, MIM#137164). [Color figure can be viewed in the online issue, which is available at www.interscience.wiley.com.]
