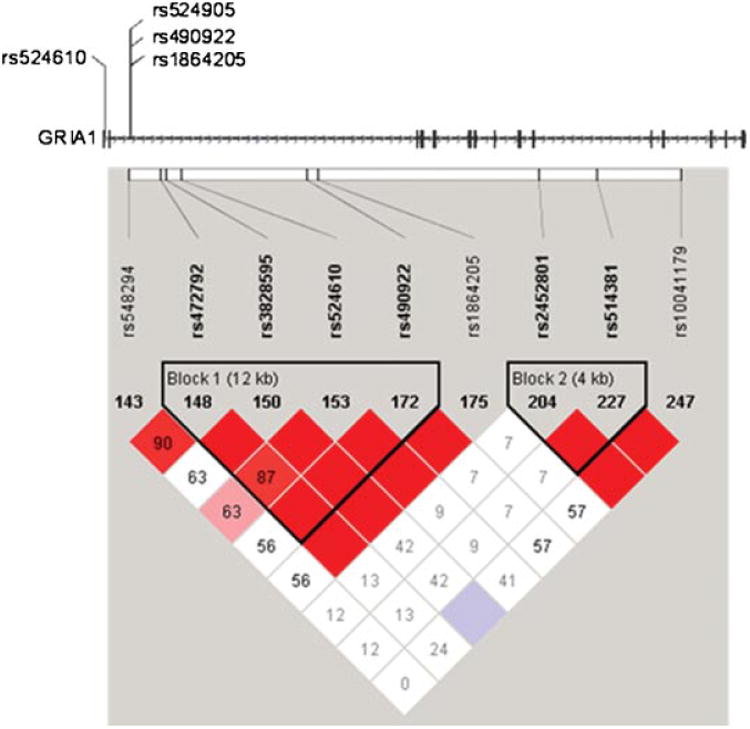
Fig. 2.

Haplotype structure in the first and second intron of GRIA1. Several SNPs in the first and second intron of the GRIA1 gene are in strong linkage disequilibrium. Localization of the SNPs, which individually or in haplotypes show significant association, is presented on the gene structure (horizontal bars indicate exons, arrows indicated gene orientation). Haploblock structure of the 5′ portion of the GRIA1 gene is shown below. Linkage disequilibriumis expressed in r2 values. [Color figure can be viewed in the online issue, which is available at www.interscience.wiley.com.]
