
Fig. 3.
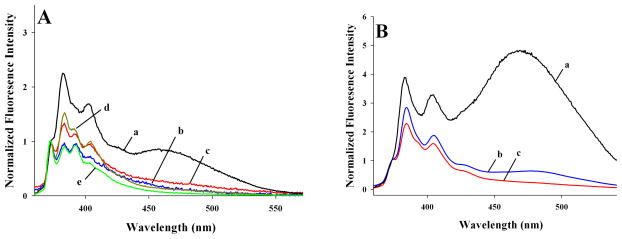
Fluorescence emission spectra of nHDL- and rHDL-associated pyrene-labeled apoE. A. Fluorescence emission spectra of pyr-apoE3 (~ 5 μg/ml protein) were recorded in lipid-free state (a), nHDL Top (b) and Mid (c) fractions and rHDL-associated states with POPC (d) or POPC/cholesterol (e). B. Fluorescence emission spectra of pyr-apoEA277C(201-299) were recorded in lipid-free state (a), nHDL (b) and rHDL-associated states with POPC/cholesterol (c). The spectra shown are average of 4 scans (excitation at 345 nm) and normalized with respect to the peak at 375 nm.