
Figure 1. CovR binding sites at different promoters.
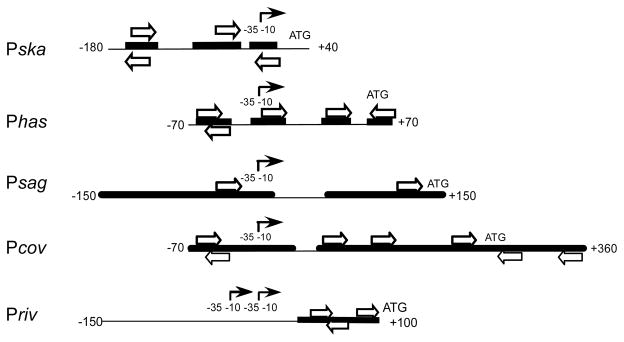
The interaction between CovR and different promoters is represented by regions protected by CovR from nuclease digestion (heavy black lines) and consensus or near-consensus CovR binding sequences (open arrows). (For clarity, not all near-consensus sequences are shown.) The promoters (indicated by the solid arrows) are aligned by their start points of transcription. Only one of the two closely overlapping promoters of Pska is shown.