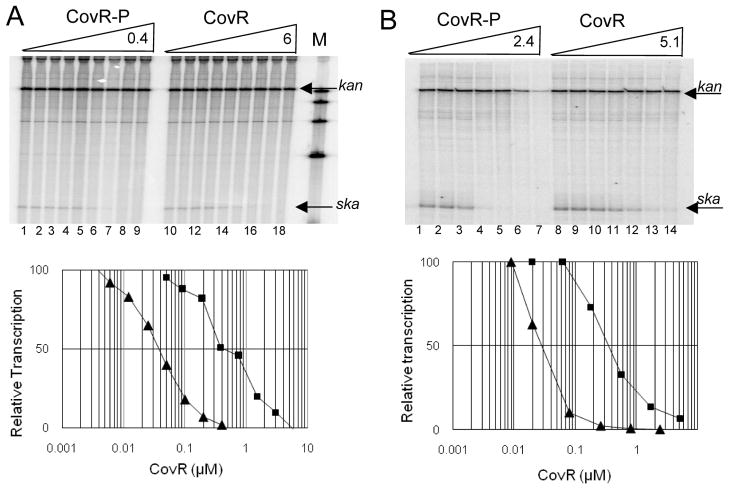
Figure 5. Repression of Pska by CovR and CovR-P in vitro.
A. Run-off transcriptions using a wild-type template. Upper panel: Lanes 1–9 ; CovR-P at concentrations of 0, 0.003, 0.006, 0.012, 0.025, 0.050, 0.1, 0.2 and 0.4 μM respectively. Lanes 10–18: CovR at concentrations of 0, 0.05, 0.09, 0.19, 0.38, 0.75, 1.5, 3.0 and 6.0 μM respectively. Lane M: molecular weight markers. The transcripts originating from Pska and Pkan are indicated by the arrows. Lower panel. Densitometric analysis of the median transcript volume. Data is plotted as the ratio of ska/kanR transcript in the presence of CovR-P (triangles) or CovR (squares). The amount of transcript generated in the absence of CovR was defined as 100% and relative transcription was determined by the amount of transcript generated at a given CovR or CovR~P concentration divided by the amount of transcript with no CovR or CovR~P present. B. Run-off transcriptions using a truncated template. Upper panel: Lanes 1–7; CovR-P at concentrations of 0, 0.009, 0.2, 0.008, 0.026, 0.8, and 2.4 μM respectively. Lanes 8–14: CovR at concentrations of 0, 0.02, 0.06, 0.18, 0.56, 1.7 and 5.1 μM respectively. The transcripts originating from Pska and Pkan are indicated by the arrows. Lower panel. Densitometric analysis of the median transcript volume as described in A above.

