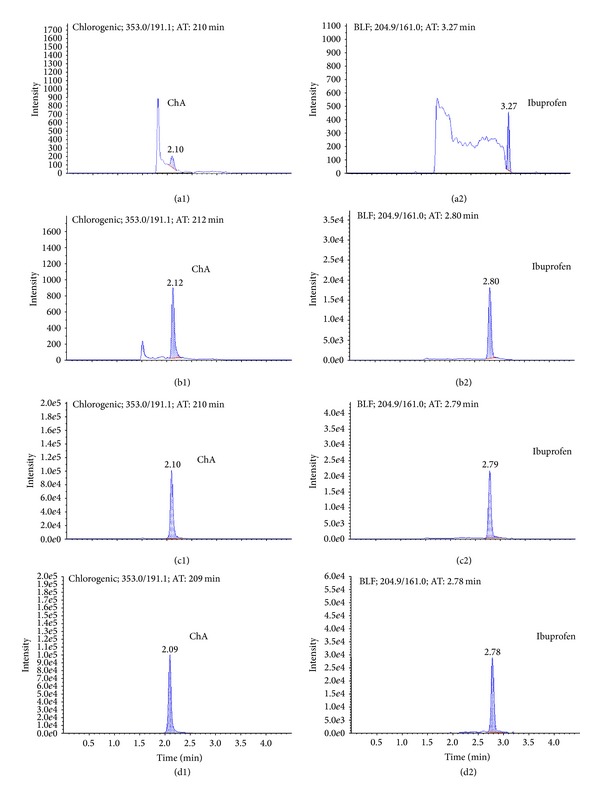
Figure 2.

Representative mass spectrum of ChA and ibuprofen. (a1) Blank plasma sample of ChA. (a2) Blank plasma sample of ibuprofen. (b1) Standard calibration plasma sample with ChA at LLOQ level (7.820 μg/L). (b2) Standard calibration plasma sample with ibuprofen at LLOQ level. (c1) Plasma sample after administration of LJF extract of ChA. (c2) Plasma sample after administration of LJF extract of ibuprofen. (d1) Liver sample of ChA. (d2) Liver sample of ibuprofen.
