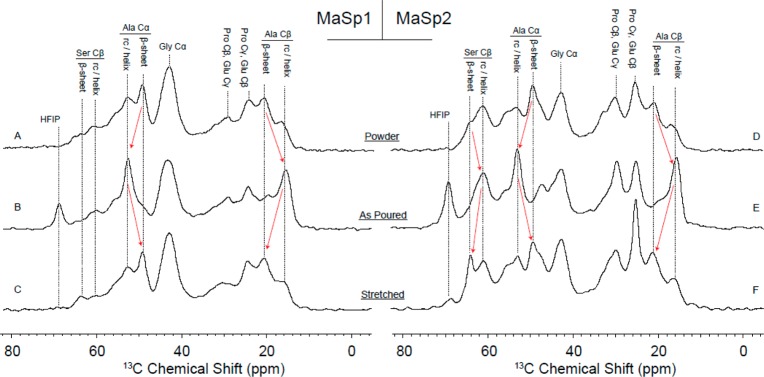
Figure 10.

1H–13C CP-MAS spectra of MaSp1 films (left) and MaSp2 films (right) in various stages of production. Some resonances from dominant amino acids glycine, alanine, serine, proline, and glutamine are highlighted with dotted lines, and protein secondary structure is indicated when appropriate. Red arrows are used to emphasize structural changes occurring during production. From top to bottom: Purified protein powder (A, D), as-poured films from solubilized protein in HFIP (B, E), and films stretched in 80/20 MeOH/water (C, F).
