
Figure 7.
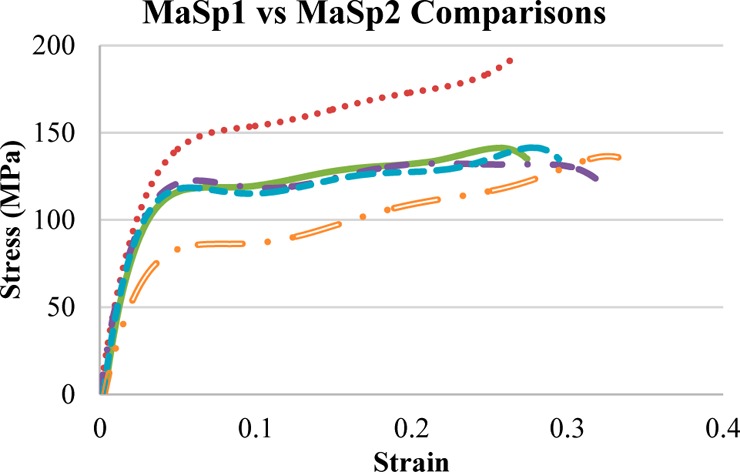
Stress–strain graphs comparing films composed of MaSp1, MaSp2, or a mixture of MaSp1/MaSp2; all samples received the same post-pour treatment, with the following legend: MaSp1 (dashed line), 75/25 MaSp1/MaSp2 (solid line), 50/50 MaSp1/MaSp2 (single dotted dashed line), 25/75 MaSp1/MaSp2 (dashed line), and MaSp2 (double dotted dashed line).