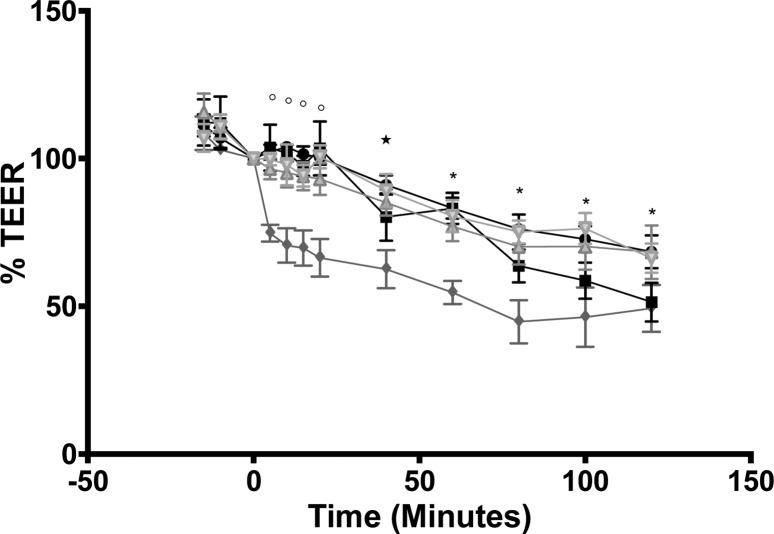
Figure 4.
Percent TEER changes of isolated jejunal tissue: control (●), G4 dendrimers 1.0 mM (■), G3.5 dendrimers 1.0 mM (◆), FITC-dextran 4 kDa (Δ), FITC-dextran 10 kDa (∇). Percent TEER values were calculated as a percentage of the initial TEER at t = 0 in each group. Significant differences from TEER of each individual group at t = 0 are marked with open circles (G3.5 dendrimers), star (control, G3.5 dendrimers, FITC-dextran 4 kDa), and asterisk (all groups).

