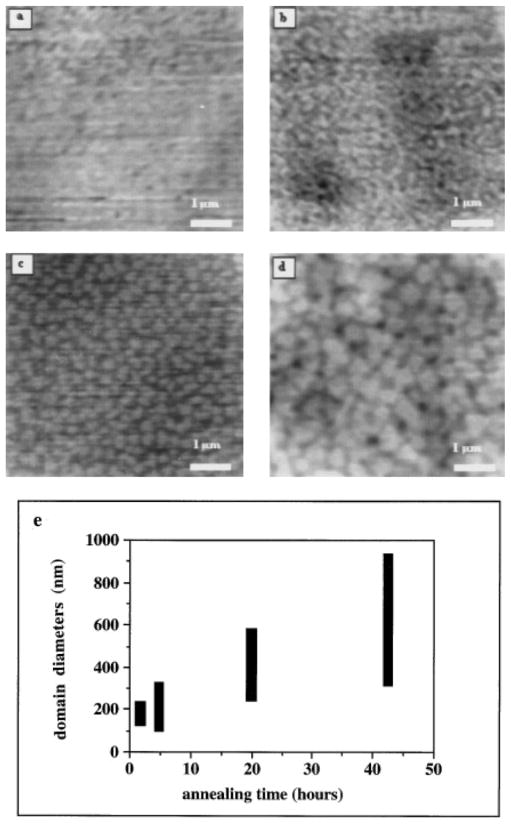
FIG. 5.
Annealing induced OTS domain aggregation on the sample shown in Fig. 2f. The 115°C annealing process was interrupted at various times to allow the sample to be imaged with the AFM. After AFM analysis, the sample was immediately returned to the nitrogen oven for additional annealing. The sample after (a) 1.5 h of annealing; (b) 4.75 h; (c) 19.75 h; (d) 42.5 h. The average diameters of the condensed domains steadily increase with annealing due to enhanced surface diffusion and aggregation of the adsorbed OTS (shown in (e)).

