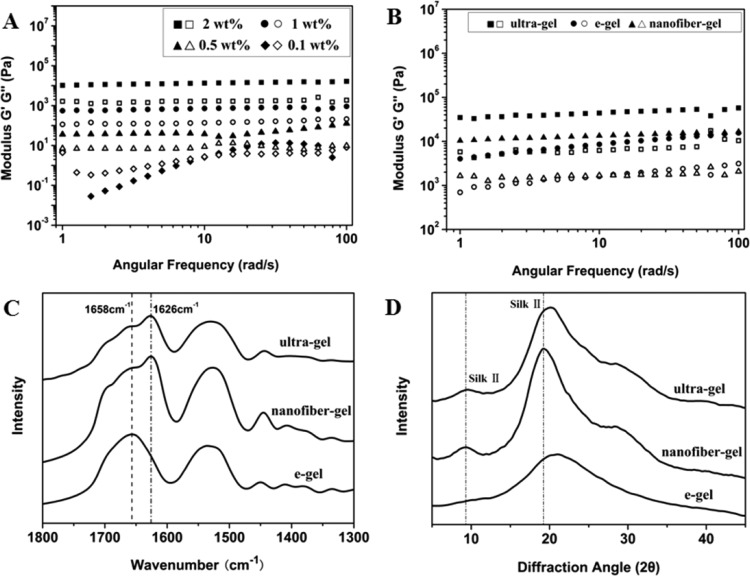
Figure 2.
Storage modulus (G′, filled symbols) and loss modulus (G″, open symbols) versus frequency of different concentration of silk in the solution-hydrogel transition process (A); and storage modulus (G′, filled symbols) and loss modulus (G″, open symbols) versus frequency of silk gels with concentration of 2 wt % prepared through ultrasonication treatment (ultragel, hydrogels prepared by ultrasonicating fresh silk solution at the 20% amplitude setting for 30 s), electric field treatment (e-gel), and self-assembled nanofiber transition in our present study (nanofiber-gel) (B). The secondary structures of silk in the different gels were investigated with FTIR spectra (C) and XRD peak (D).

