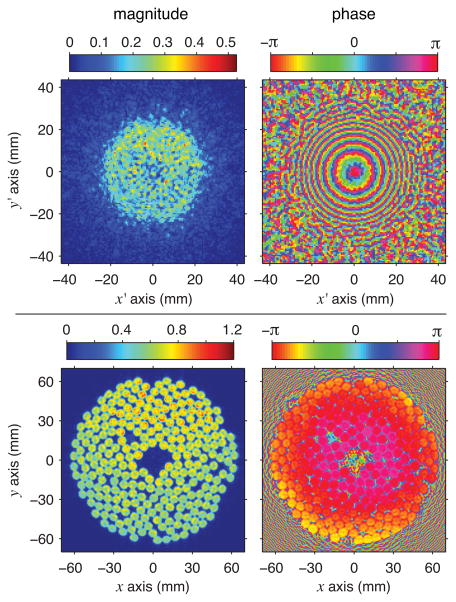
Fig. 2.
Holograms representing the continuous-wave linear acoustic field with no beam steering (color online): measured pressure hologram in megapascals (top) and source hologram calculated by backpropagating the acoustic field to the surface of the transducer (bottom). Note that the source hologram depicts acoustic velocity normal to the transducer surface, with magnitudes normalized relative to the maximum value.

