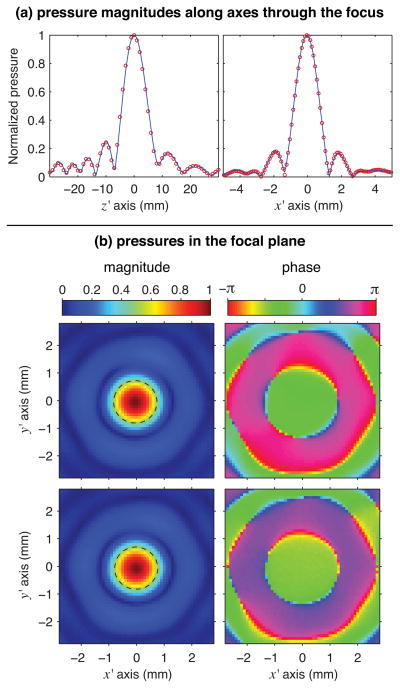
Fig. 3.
Comparison of the structure of the linear acoustic field as measured directly with a capsule hydrophone and as calculated from a 2-D hologram measured separately (color online). (a) Along focal axes with coordinates plotted relative to the pressure maximum, calculated pressure magnitudes are shown as solid lines and independent measurement data as circles. (b) In the focal plane, pressure magnitude and phase are either calculated from a hologram measured pre-focally (top) or directly measured (bottom). The dashed line in each magnitude plot is a contour marking the −6 dB focal region.

