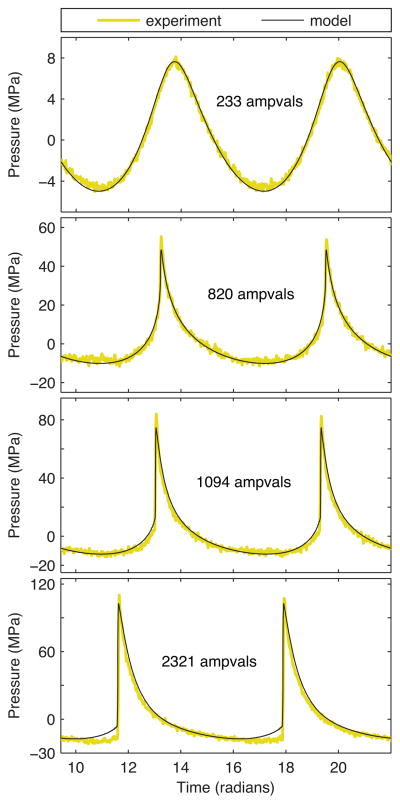
Fig. 5.
Comparison of focal waveforms with no beam steering (color online). Experimental waveforms were measured directly with a fiber optic hydrophone. Simulated waveforms utilized boundary conditions defined by calibration measurements for the power level (Fig. 4 and Table I) in combination with a source vibration pattern based on the source hologram (Fig. 2).

