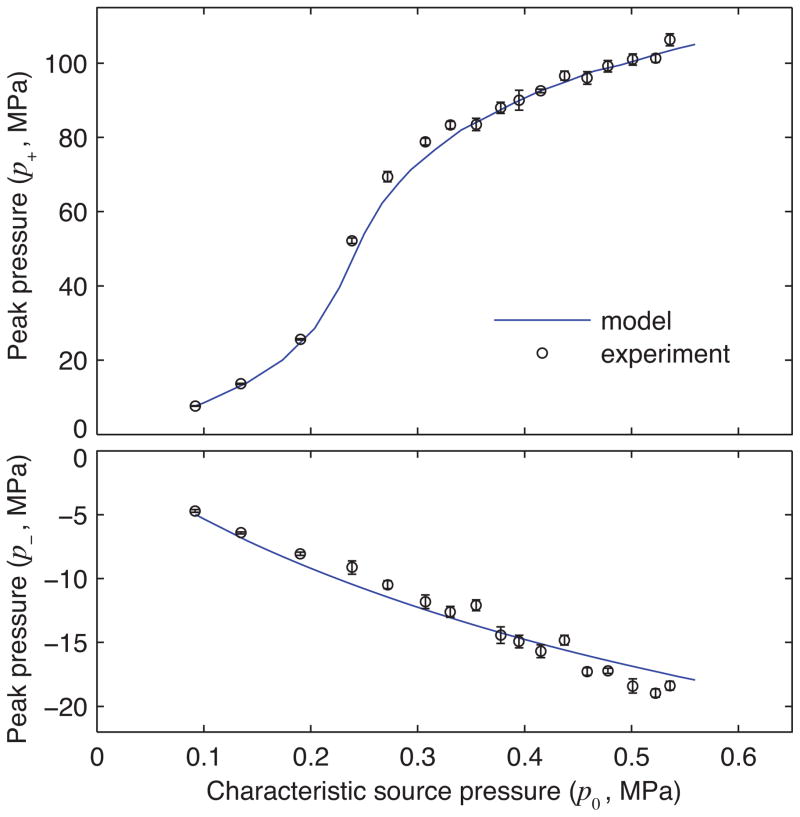
Fig. 6.
Summary of waveform comparisons between simulations and measurements with no beam steering (color online): peak positive (top) and negative (bottom) pressures at the focus are plotted against the source pressure output. Experimental peak values are represented as a mean value ± one standard deviation over 8 acoustic cycles.

