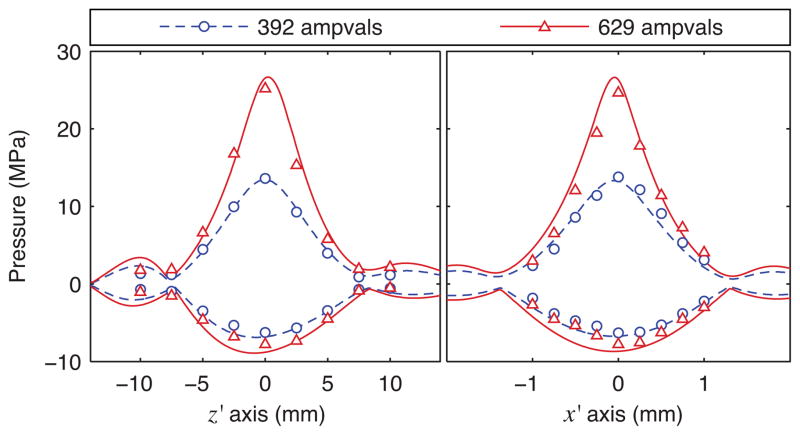
Fig. 7.
Beam profiles along axes passing through the focus (no beam steering) (color online). The dashed and solid lines represent the peak positive and peak negative pressures based on modeled waveforms. The circles and triangles represent experimental data. In each plot, data for two power levels are included, where 392 and 629 ampvals correspond to nominal acoustic powers of 50 and 100 W respectively.

