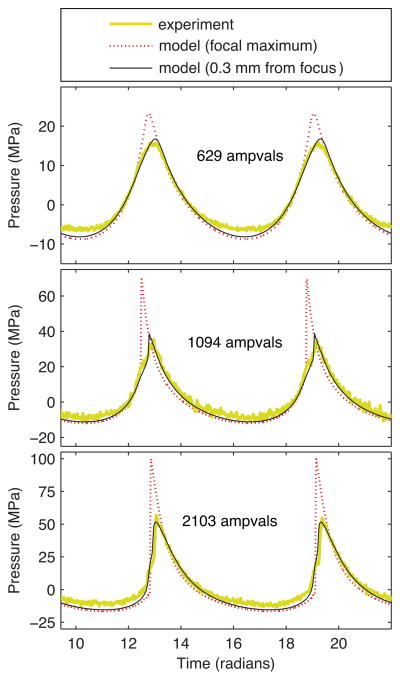
Fig. 9.
Comparison of focal waveforms for the steering case (color online). Experimental waveforms were measured directly with a fiber optic hydrophone, while simulated waveforms utilized boundary conditions determined by the source hologram from Fig. 8 and power levels described by holography units from the fifth column in Table I. For model simulations, the focal maximum occurred at y = −7.4 mm, while waveforms at y = −7.7 mm approximately match the experimental data.

