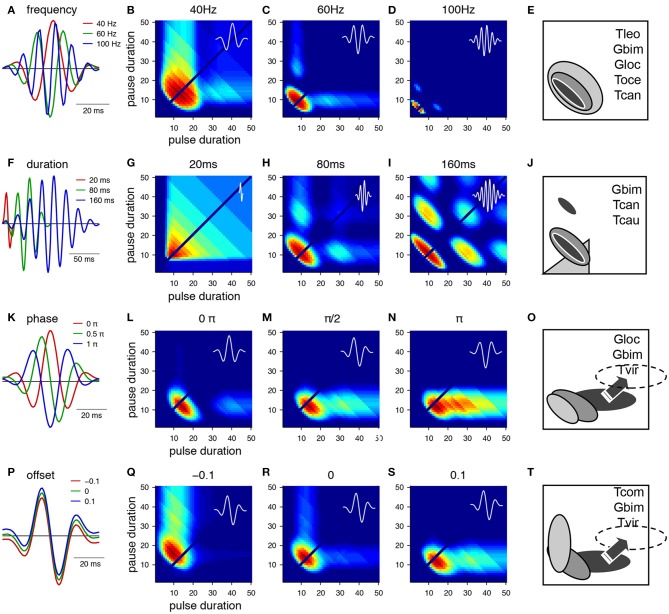
Figure 3.
From Gabor filters to behavioral preference functions for a pulse pattern. (A–E) Variation of the frequency and resulting preference profiles. (F–J) Variation of filter duration. (K–O) Variation of phase. (P–T) Variation of offset. Shaded profiles on the right indicate known preference functions for pulse patterns in crickets and katydids. The pulse profile of Tettigonia viridissima, Tvir, was shifted from its original position (see arrow, dashed area). Species: Gbim: Gryllus bimaculatus, Gloc G. locorojo, Tleo Teleogryllus leo, Toce Teleogryllus oceanicus, Tcan Tettigonia cantans, Tcau Tettigonia caudata, Tvir Tettigonia viridissima, Tcom Teleogryllus commodus, see text for references. For calculation of the preference functions, pulse trains with different combinations of pulse durations and pause durations were created (chirp period 500 ms, chirp pause 250 ms). Each stimulus was filtered with the function shown in the first row (A,F,K,P) and passed through a sigmoidal nonlinearity (c.f. Figures 2D,E). The phonotaxis value was taken as the integral output of the nonlinearity (for details see Clemens and Hennig, 2013).

