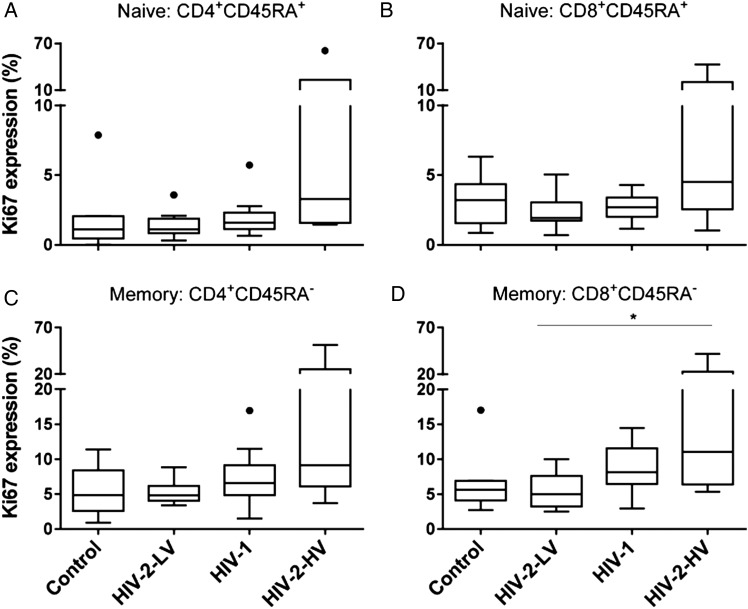
Figure 2.
Ki67 expression in naive and memory T-cells in controls and HIV infection. Values represent proportion of cells expressing Ki67 within T-cells populations: (A) CD4+CD45RA+ and (B) CD8+CD45RA+ “naive” cells; (C) CD4+CD45RA− and (D) CD8+CD45RA− “memory” cells. Line, box and whiskers represent median, IQR and range; outliers shown as dots using Tukey criteria. Group differences tested by ANOVA: (A) 0.082, (B) 0.052, (C) 0.055, (D) 0.035; *P < .05 by post hoc (Tukey) test. Trend analysis, P < .05 for both CD4+ and CD8+ memory (CD45R0+) populations. Abbreviations: ANOVA, analysis of variance; HIV, human immunodeficiency virus; HIV-2-HV, HIV-2 infected with high viral load (>1000 copies/mL); HIV-2-LV, HIV-2 infected with low viral load (<100 copies/mL); IQR, interquartile range.

