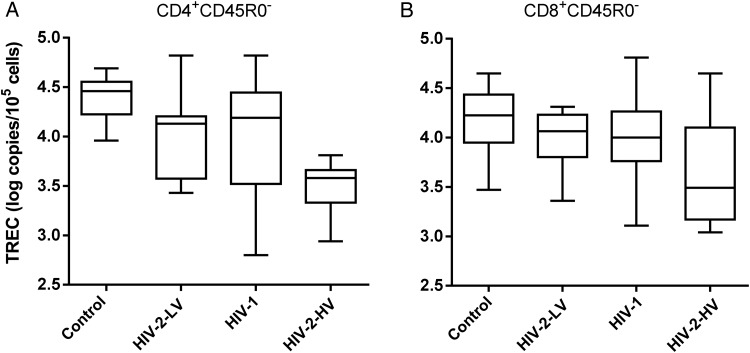
Figure 4.
TREC content of naive CD4+ and CD8+ T-cells. TREC content shown as log copies per 105 cells for (A) CD4+CD45R0− and (B) CD8+CD45R0− “naive” T-cells. Line, box, and whiskers represent median, IQR, and range, respectively. ANOVA (nonparametric): P = .004, P = .19 respectively; *significant intergroup difference by post hoc testing. Trend across groups was significant (P < .001) for CD4+ cells, with HIV-2-HV group having lowest TREC content values in naive cells, but not for CD8+ cells (P = .056). Abbreviations: ANOVA, analysis of variance; HIV, human immunodeficiency virus; HIV-2-HV, HIV-2 infected with high viral load (>1000 copies/mL); HIV-2-LV, HIV-2 infected with low viral load (<100 copies/mL); IQR, interquartile range; TREC, T-cell receptor excision circle.

