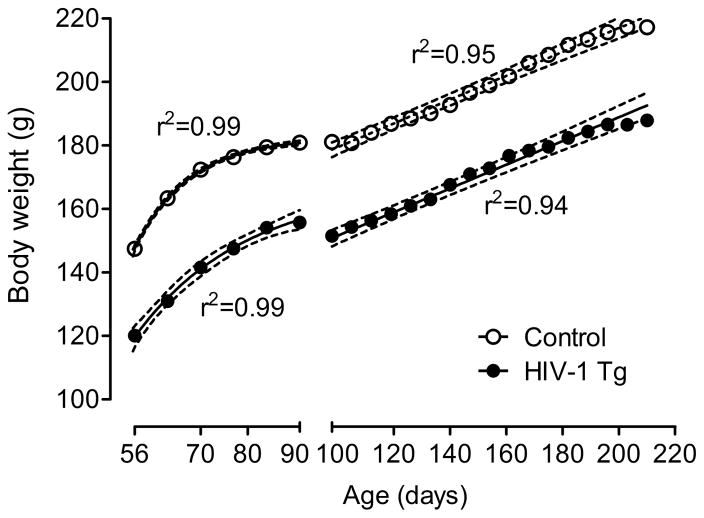
Fig. 1.
Mean body weight of the HIV-1 Tg animals and control animals across age with the best fit nonlinear regression for each group (± 95% CI). The HIV-1 Tg group weighed significantly less than the control group across the 6-month period during which they were tested. Both groups increased significantly in body weight across this period; most importantly, there was no evidence for any differential rate of growth. The x-axis break at 100 days indicates the point at which animals began food restriction, prior to testing.

