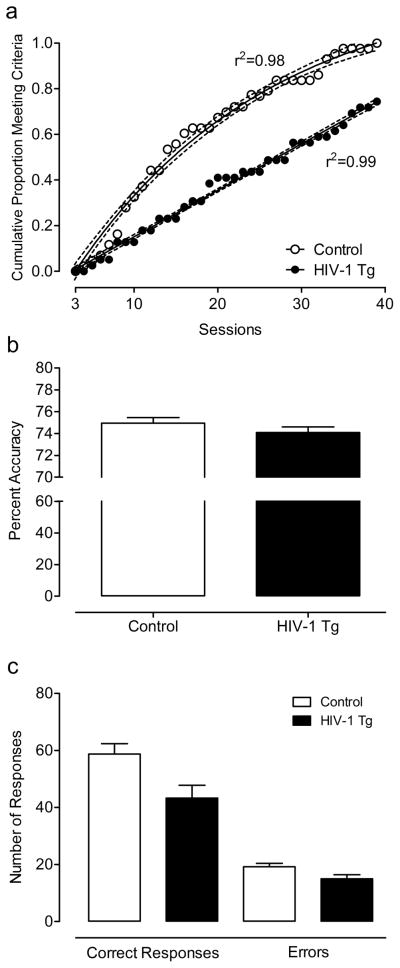
Fig. 3.
Performance on the stimulus discrimination task. Regression analyses revealed that the rate at which each group achieved the criterion followed different functions; the HIV-1 Tg animals exhibited a linear function whereas the control group showed a curvilinear one-phase association function, illustrating the slower acquisition of the task by the HIV-1 Tg animals over sessions (a). There was no significant difference in percent accuracy (3-day average: HIV-1 Tg: 74.9 ± 0.52; Control: 74.1 ± 0.51) (b). Despite attaining the same accuracy, the HIV-1 Tg animals that met the criterion made significantly fewer overall responses, with a smaller difference between the number of correct responses and the number of errors in HIV-1 Tg group compared to control group (c).

