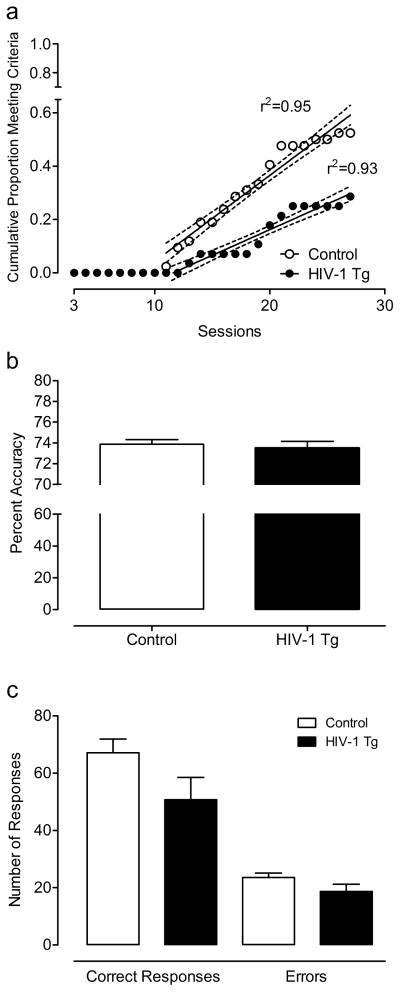
Fig. 4.
Performance on the reversal learning task. Linear regression analysis on the cumulative proportion of animals that achieved the criterion over sessions revealed that each group met the criterion at different rates, demonstrated by significantly different slopes for each group’s linear function (a). Of the animals that met the criterion, there was no difference in percent accuracy (3-day average: HIV-1 Tg, 73.5 ± 0.66; Control, 73.9 ± 0.43) (b). There was also no significant difference between groups in the total number of responses, and there was no interaction between group and response type (correct responses or errors) (c).

