
Figure 2.
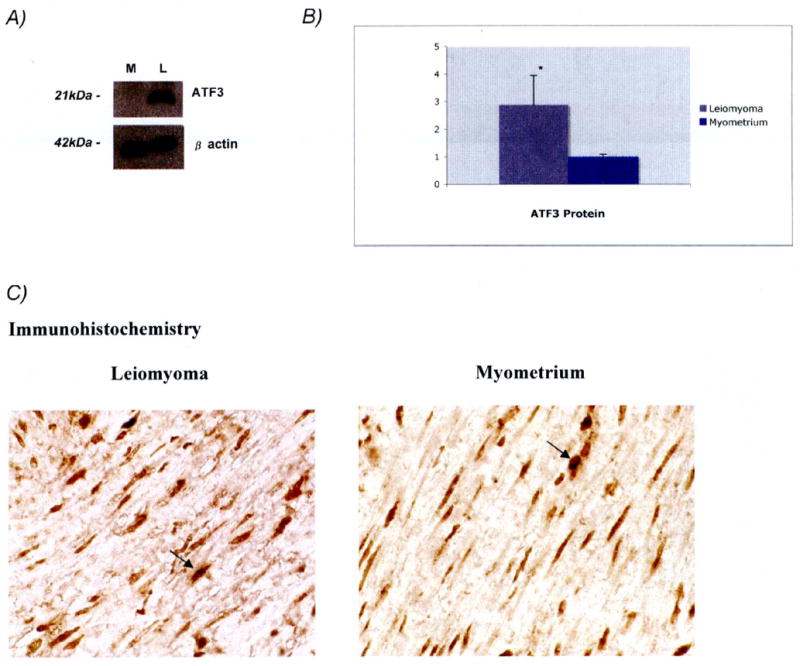
Assessment of ATF3 protein expression
A. Western Blot showing ATF3 protein expression (21kDa bands) using 10μg each of representative myometrium (M) and leiomyoma (L) lysates (upper panel). β actin (42kDa bands) was used as a control (lower panel). B. Graphical representation of mean fold protein expression (leiomyoma:myometrium) for ATF3 protein in leiomyoma (black bar) and myometrium (white bar) from 8 sample pairs determined by pixel intensity, P<0.05 (two-tailed Student's t-test). ATF3 was found to be more abundant in leiomyoma. C. Immunohistochemical images of ATF3 protein in leiomyoma and corresponding myometrium at 63× magnification. Intracellular staining of ATF3 is demonstrated by the arrows. Similar staining patterns were seen in 6 different sample pairs (not shown).