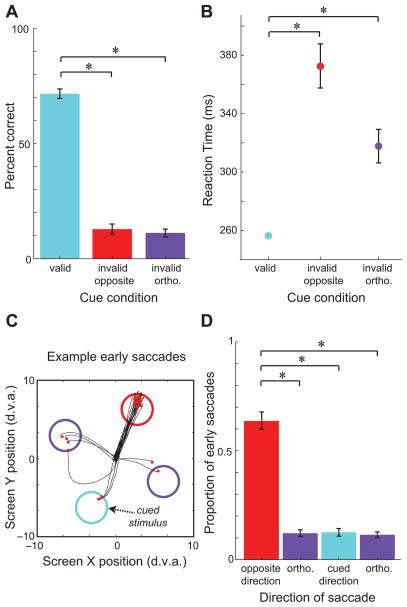
Figure 2. Effects of cueing on behavioral measures.
A. Effect of cue validity on performance. The plot compares the rate of correct responses to orientation changes with valid and invalid cues. B, Effect of cue validity on reaction time. The plot compares the time between the orientation change and the onset of a correctly executed response across conditions. C, Examples of saccades executed after the onset of the cue, but before the blank period. Colored circles represent stimulus positions. Black traces and red dots indicate path of eye position and saccade endpoint, respectively, for all saccades from one behavioral session and one cue direction. D, Mean proportion of early saccades made to each stimulus, sorted relative to the direction of the cue. Error bars denote S.E.M.; asterisk = p<0.01.

