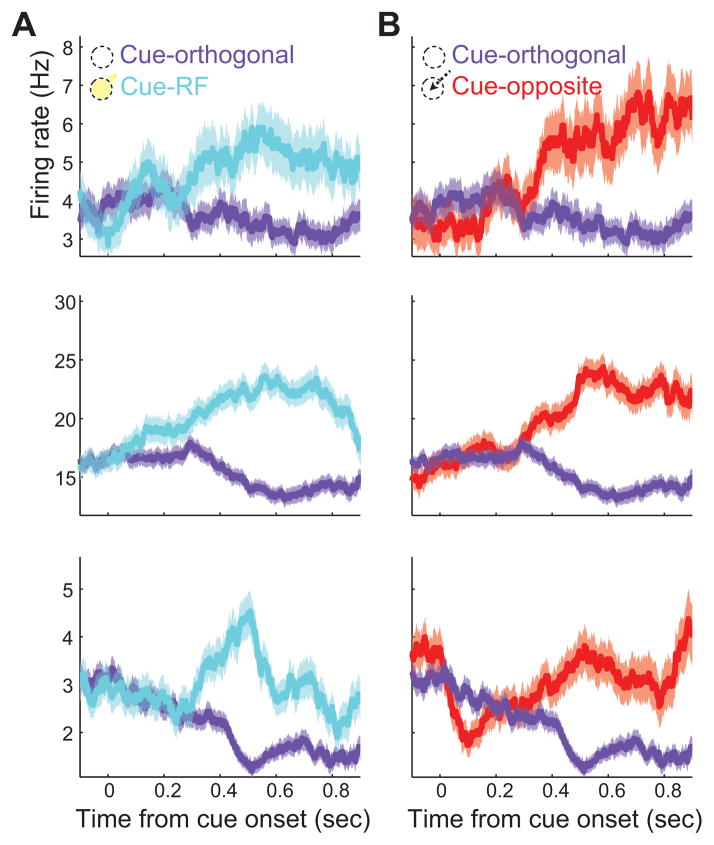
Figure 3. Responses of example neurons in the cued change-detection and antisaccade task.
A, Peristimulus time histogram of spiking activity around the time of cue onset for cue-RF (cyan) trials relative to cue-orthogonal (purple) trials. Shaded region indicates ±1 standard error of the mean. B, As in A, but for cue-opposite (red) trials relative to cue-orthogonal.

