
Figure 8. Difference in LFP power between cue conditions across frequencies.
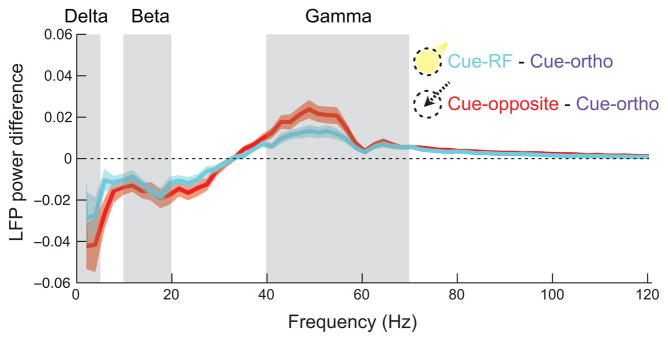
Fourier transforms were computed for the final 500ms of the post-cue period for each trial and each channel, then averaged across trials and channels within each cue condition and recording. The mean differences, cue-RF minus cue-orthogonal (cyan) and cue-opposite minus cue-orthogonal (red), across recordings are represented with shaded regions reflecting ±1 S.E.M.