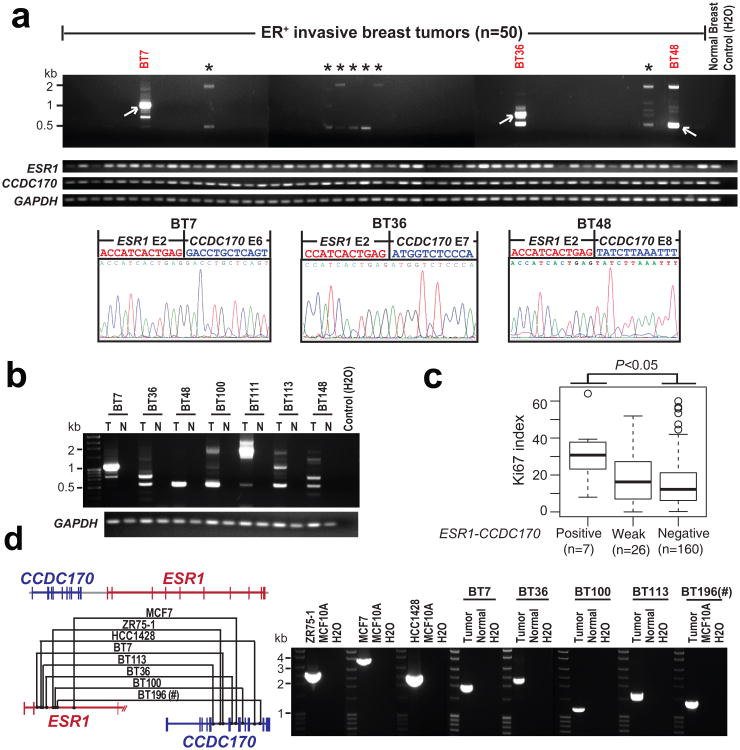
Figure 2. Characterization of the ESR1-CCDC170 fusion in breast cancer cell lines and tissues.
(a) Representative RT-PCR results of ESR1-CCDC170, wtESR1, and wtCCDC170 in ER+ breast cancer tissues. * Weak ESR1-CCDC170 transcripts detected by RT-PCR. (b) RT-PCR analysis of ESR1-CCDC170 in paired tumor (T) and adjacent normal tissues (N) from seven strong positive cases. (c) The Ki67 index for ESR1-CCDC170 positive, weak, and negative cases evaluated by IHC assay using available tissue sections for 193 ER+ cases assessed for ESR1-CCDC170 expression. P-value was determined by t-test. (d) Genomic PCR analysis of the positive cell lines and 5 strong positive tumor samples, confirming the ESR1-CCDC170 rearrangements. Left panel shows the schematic of identified genomic fusion points in different samples; right panel shows the gel image of ESR1-CCDC170 genomic PCR products. #Paired normal tissue is not available for BT196.

