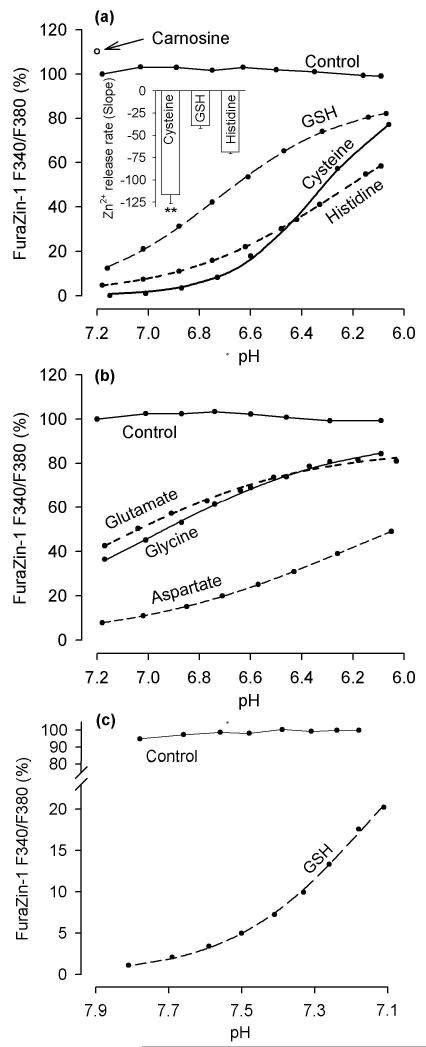
Fig. 3.
Effects of pH on Zn2+ chelation by tested ligands. (a) Acid-induced Zn2+ release from GSH, cysteine, and histidine. The ligands (1 mM) were added to a solution containing 100 nM FuraZin-1, 100 mM KCl, and 50 mM PIPES (37 °C) and the FuraZin-1 signal was measured while pH was manipulated. The inset shows the slopes in the pH range 6.6 - 6.1 (these slopes reflect the rates of Zn2+ release from the ligands when pH was decreasing from 6.6 to 6.1); the data are means ± SEM from five to seven experiments identical to those shown in the main figure; ** p < 0.01, Cysteine vs GSH, and Cysteine vs Histidine, one way ANOVA followed by Student-Newman-Keuls test. (b) Acid-induced Zn2+ release from glutamate, glycine, and aspartate. The ligands (10 mM) were tested the same way as described in (a). (c) The effect of pH drop from 7.9 to 7.1 on Zn2+ chelation by 1 mM GSH. The experiment was performed as described in (a) except that MOPS (instead of PIPES) was used as pH buffer. In all panels, the data are expressed as a percentage of the FuraZin-1 F340/F380 signal measured at pH 7.2 prior to the addition of the ligands; the Control refers to the FuraZin-1 signals measured in the absence of the ligands.

