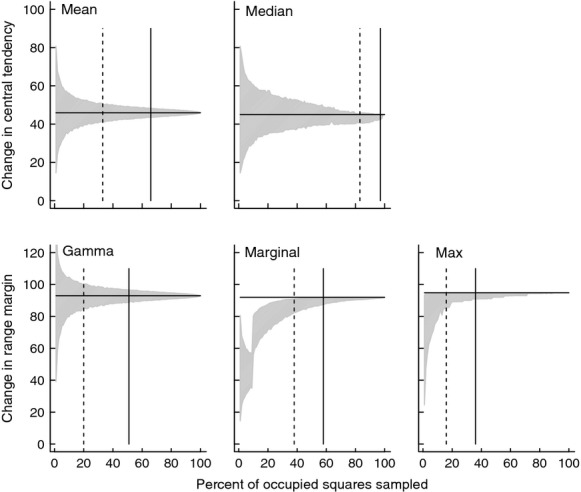
Figure 4.

Sensitivity of five range expansion statistics (mean, median, gamma quantile, marginal mean, and maximum) to sampling effort ranging from 1 to 100% of the 2008–2010 survey data. The true state of the system is the horizontal line, calculated when 100% of the data are sampled. At each level of sampling effort, the gray area shows the 95% confidence interval (i.e., 0.025 & 0.975 quantiles) of 10,000 resamples. The vertical solid line indicates the minimum level of sampling effort required for the 95% CIs to be within 5% of the true value; the vertical dashed line is within 10% of the true value.
