Figure 2.

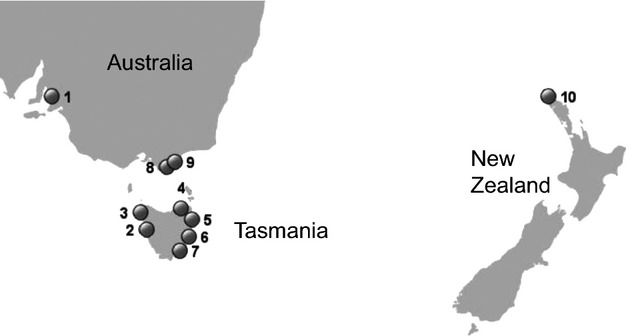
Map of the sampling area. Details on sampling sites 1–10 are given in Table 2. Populations at sites 1, 8, 9, and 10 are potentially non-native.

Map of the sampling area. Details on sampling sites 1–10 are given in Table 2. Populations at sites 1, 8, 9, and 10 are potentially non-native.