
Figure 4.
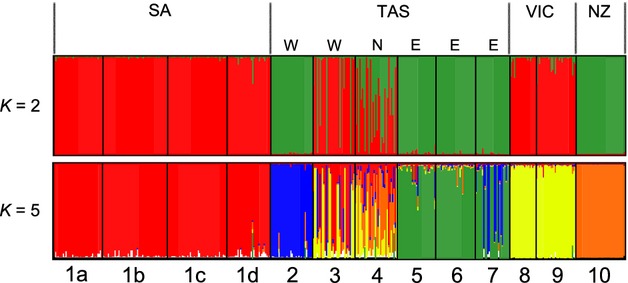
Bar plots depicting the assignment of individuals of Pyura doppelgangera from 10 sites to a specified number of clusters (K). Each individual is represented by a thin vertical bar. Geographic regions are shown on top, the number of genetic clusters (K) on the left, and population numbers (see Table 2) below (SA, South Australia; TAS, Tasmania; VIC, Victoria; NZ, New Zealand; W, west; N, north; E, east).