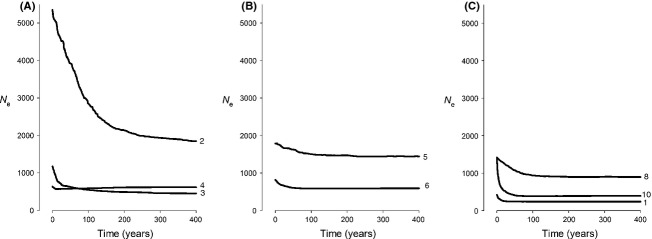
Figure 5.

Extended Bayesian Skyline Plots of microsatellite data from eight of the 10 sites at which Pyura doppelgangera was collected; (A) eastern Tasmania; (B) northern and western Tasmania; (C) non-Tasmanian sites. Sites 7 and 9 were not included because evidence for a mixed origin suggested that the data from these sites violate the model's assumption that the data from each site represent a single population. To avoid losing resolution, we do not show 95% confidence intervals for Ne, nor do we show events older than 400 years (the oldest occurrence of a change in Ne at site 2).
